
Task
Using text and graphics from a 24-page print version, create a digital version of an annual report.
Timeline
Three days from receipt of assets!
Gallery
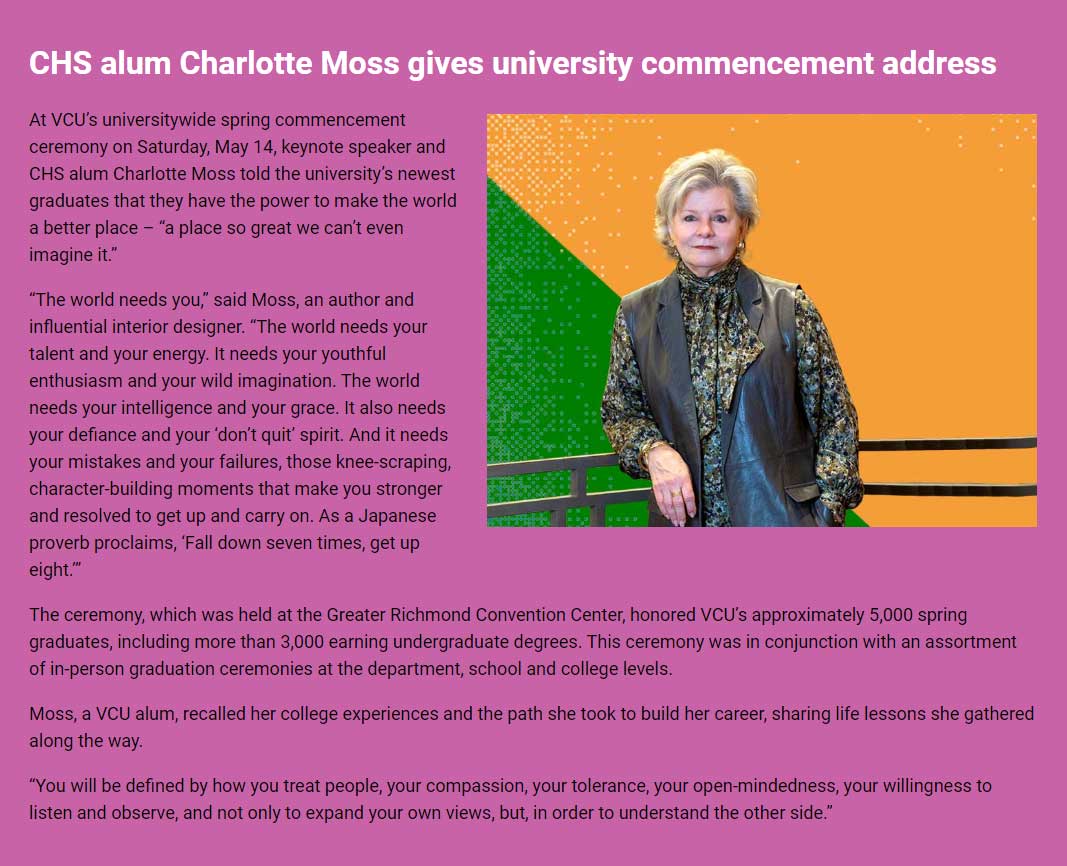
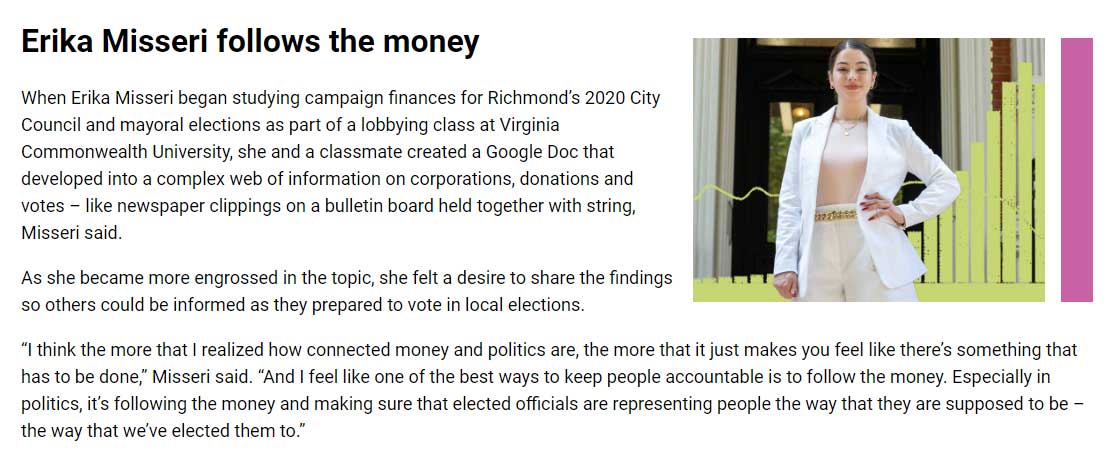
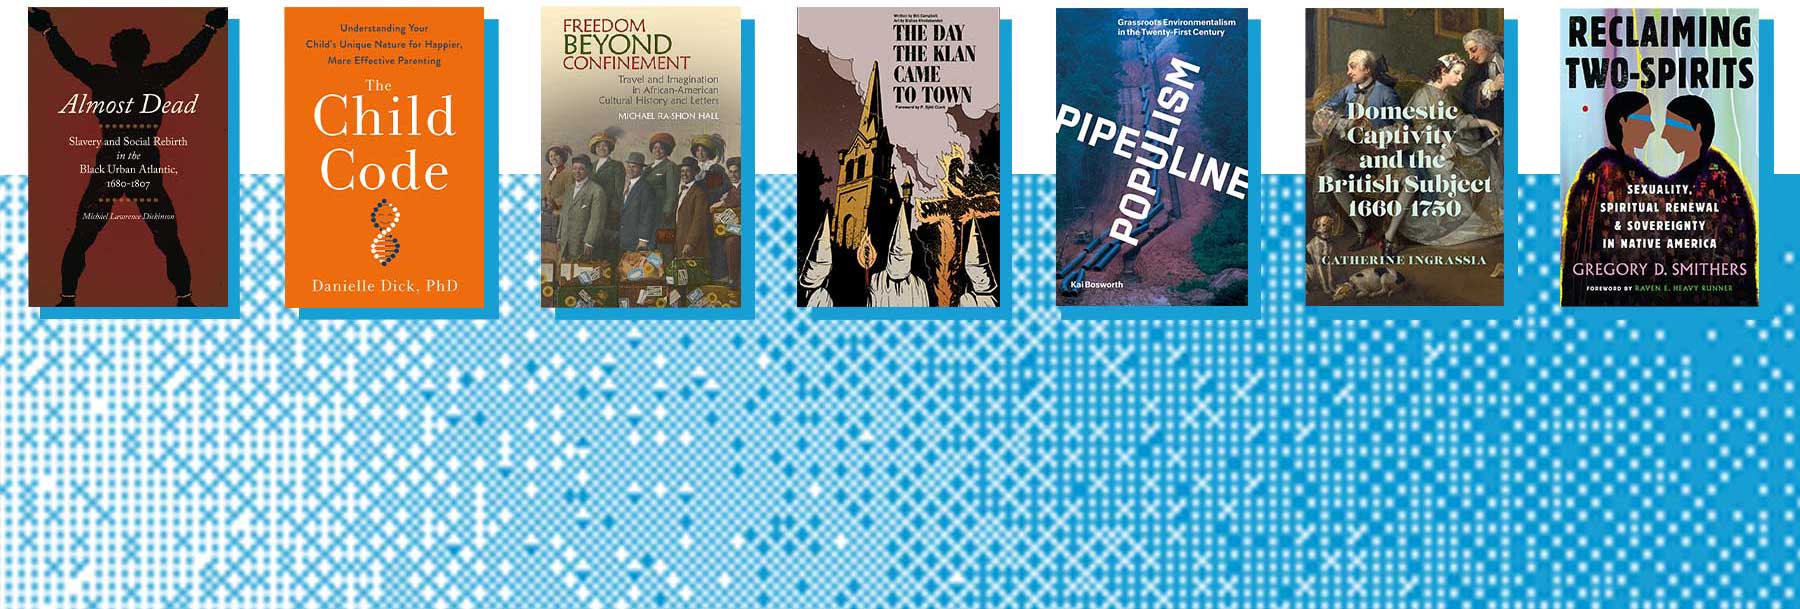
To see all pages in the digital annual report, view the live landing page and go from there. Below are select graphics and screenshots from the full 13-page report.


My Role
Using the print copy of the annual report, I directed the student graphics intern in what graphics I wanted created and which images to prep for web use. With the copy, graphics and images, I built 13 new pages in two days for distribution to thousands of alums.
Resources
- Print version of annual report
- Student intern for graphics and image prep
- Google Doc with copy
- A page layout for the landing page already in place from last year’s report
Challenges
- 3-day turnaround: To speed production time, I leaned heavily on some layouts I’ve created for past reports for the 12 child pages, but had to customize each for the update and create a few from scratch. I wrote metadata from scratch.
- Accessibility:
- The colors used in the print report did not meet color contrast guidelines for a white background, so I had to find colors complementary to the theme for text and other colored elements in the HTML that met the guidelines.
- Many graphics mimicked from the print report included text. To make sure it was accessible to screen readers, I duplicated it into the HTML and gave it an ‘sr-only’ class.
- Device compatibility: Because the assets were geared toward a print version, I had to write media queries for most pages to cover the experience on multiple viewports.
Featured Skills
- Web and device agnostic design
- Resourcefulness
- Speed and adaptability
- Accessibility
- HTML, CSS
